May 1, 2025
Critique of an interactive visualization: “World’s food consumption”
by Sergiy Nesterko
This is a T-shirt competition entry by Yiqun Zhao. Yiqun won a T-shirt this time, congratulations!
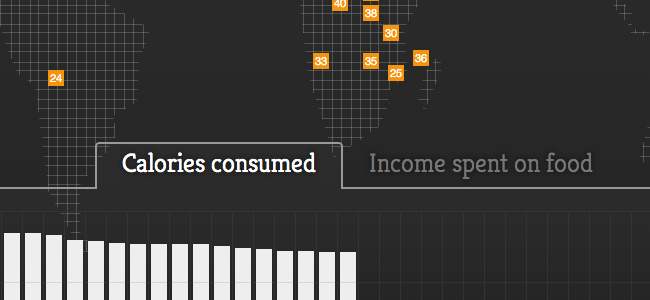
I found there is a visualization on the world’s food consumption. This is a static visualization done in 2011. This visualization included data for 20 highest consuming countries and 20 lowest consuming countries. The data points are located on a world map. When one moves the mouse onto the data point, country name, calories, and incomes spend on food will appear. Two charts, Calories consumed and Income spent on food, are shown at the bottom of the visualization webpage. This data visualization has certain advantages and disadvantages illustrated as follows.
Continue reading →
The offline save stopped at the homepage, so several critiques end where the original said “Continue reading.” Kudos: 3.