April 22, 2025
Critique of an interactive visualization: “The last three months on Foursquare”
by Sergiy Nesterko
This is a T-shirt competition entry by Jay Baxter. Jay won the T-shirt this time, congratulations!
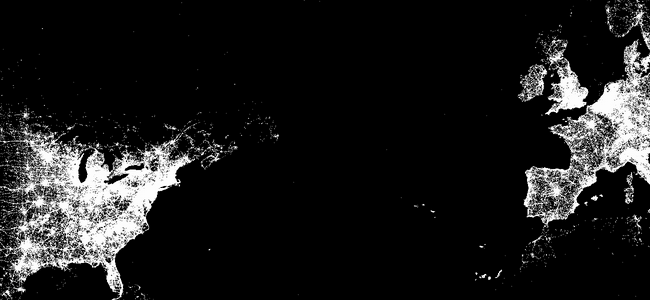
Foursquare, a location-based social networking app for mobile devices that allows users to publicly post their location (“check-in”), made an interactive visualization of the last 500 million check-ins. It is an information summary aimed at showing off Foursquare’s popularity around the globe while simultaneously providing an engaging and informative user experience.
The user is first presented with a black map of the entire world with a white dot for every check-in. It is quite beautiful and stunning: it looks very similar to satellite pictures at nighttime, where only densely populated regions are lit up. The user is allowed to zoom and scroll around the map, search for a city to zoom there, and toggle satellite imagery and map labels. The visualization is particularly fun if you zoom in all the way on the area you live to see which areas of stores are the most popular. Continue reading →
The offline save stopped at the homepage, so several critiques end where the original said “Continue reading.” Kudos: 2.