April 22, 2025
Critique of an interactive visualization: “One day of Wiki edits”
by Sergiy Nesterko
This is a T-shirt competition entry by Kevin Oh. Kevin was the second T-shirt winner for competition 5, congratulations!
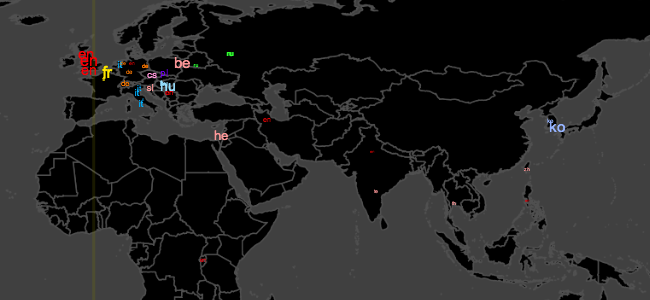
This interactive data visualization released from Wikimedia is intended to summarize and show the usage of Wikipedia around the globe. Consisting of five different pages, the visualization dedicates first three pages on displaying frequency of wiki page edit on different part of the world followed by two pages of view summary. Interactivity of this visualization is somewhat interesting, but not very effective. Unlike most of the recent interactive visualizations, users can communicate with the visualization only through keyboard commands. For instance, flipping over to different pages can be done by pressing a number button between 1 and 5, and press other keys to change the displayed language or the view. Though the use of keyboard as the interface could save some display area by removing all the buttons, but certainly not as convenient or intuitive as using GUI.
The goal of this visualization is also not very clear. It roughly summarizes how Wikipedia pages are used across the world, but what the audience, supposedly Wikipedia users, can gain from this information is not clear. Most prevalent goal of this kind of visualization is marketing such that encourage more people to start using Wikipedia and business corporations to pay more money for advertisements. However, Wikipedia is known to reserve itself from any outside advertisements. Thus, as marketing is not the possible explanation, the goal of this visualization is at best unknown. Continue reading →
The offline save stopped at the homepage, so several critiques end where the original said “Continue reading.” Kudos: 5.