April 22, 2025
Critique of an interactive visualization: “How many households have a savings account?”
by Sergiy Nesterko
This is a T-shirt competition submission by Allen Schmaltz.
I recently came across an intriguing visualization on the website associated with the book Poor Economics by Abhijit V. Banerjee and Esther Duflo.
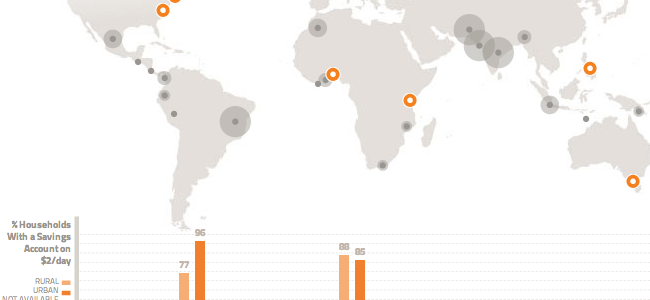
The visualization presents summary statistics regarding poor households in 17 countries and two administrative units within India. The user can readily navigate a variety of thematic areas (including among others, Education, Health, and Entrepreneurship) via the tabs at the top of the visualization. Within each thematic area, the user can select a specific set of summary statistics via a drop-down menu. The subsets are presented as questions, such as “How many households have any kind of insurance?”. Within each subset, the user chooses the income per day of the subset (on the range from $1/day to $6-10/day).
Clicking on the colored circles on the map displays a popup with a short synopsis of an applicable article and a link to the full article. Mousing over a particular area on the world map highlights the associated bar in the graph and provides a tooltip with the name of the area and its population. Clicking on the gray circles on the map, or the bars or flags in the chart, displays summary statistics for that particular area. The transitions when switching between all of these various views are smooth and fluid. Continue reading →
The offline save stopped at the homepage, so several critiques end where the original said “Continue reading.” Kudos: 3.